
A pass rate is useful because it compresses a large result set into one number. That is also its weakness. The percentage cannot explain why it moved, whether the same scope reported, or which Test Source changed the campaign outcome.
A regression can therefore display a higher pass rate while carrying more failed tests and weaker evidence than the run before it. The number is mathematically correct. The interpretation is incomplete.
A higher percentage can carry worse news
Consider two consecutive campaign reports:
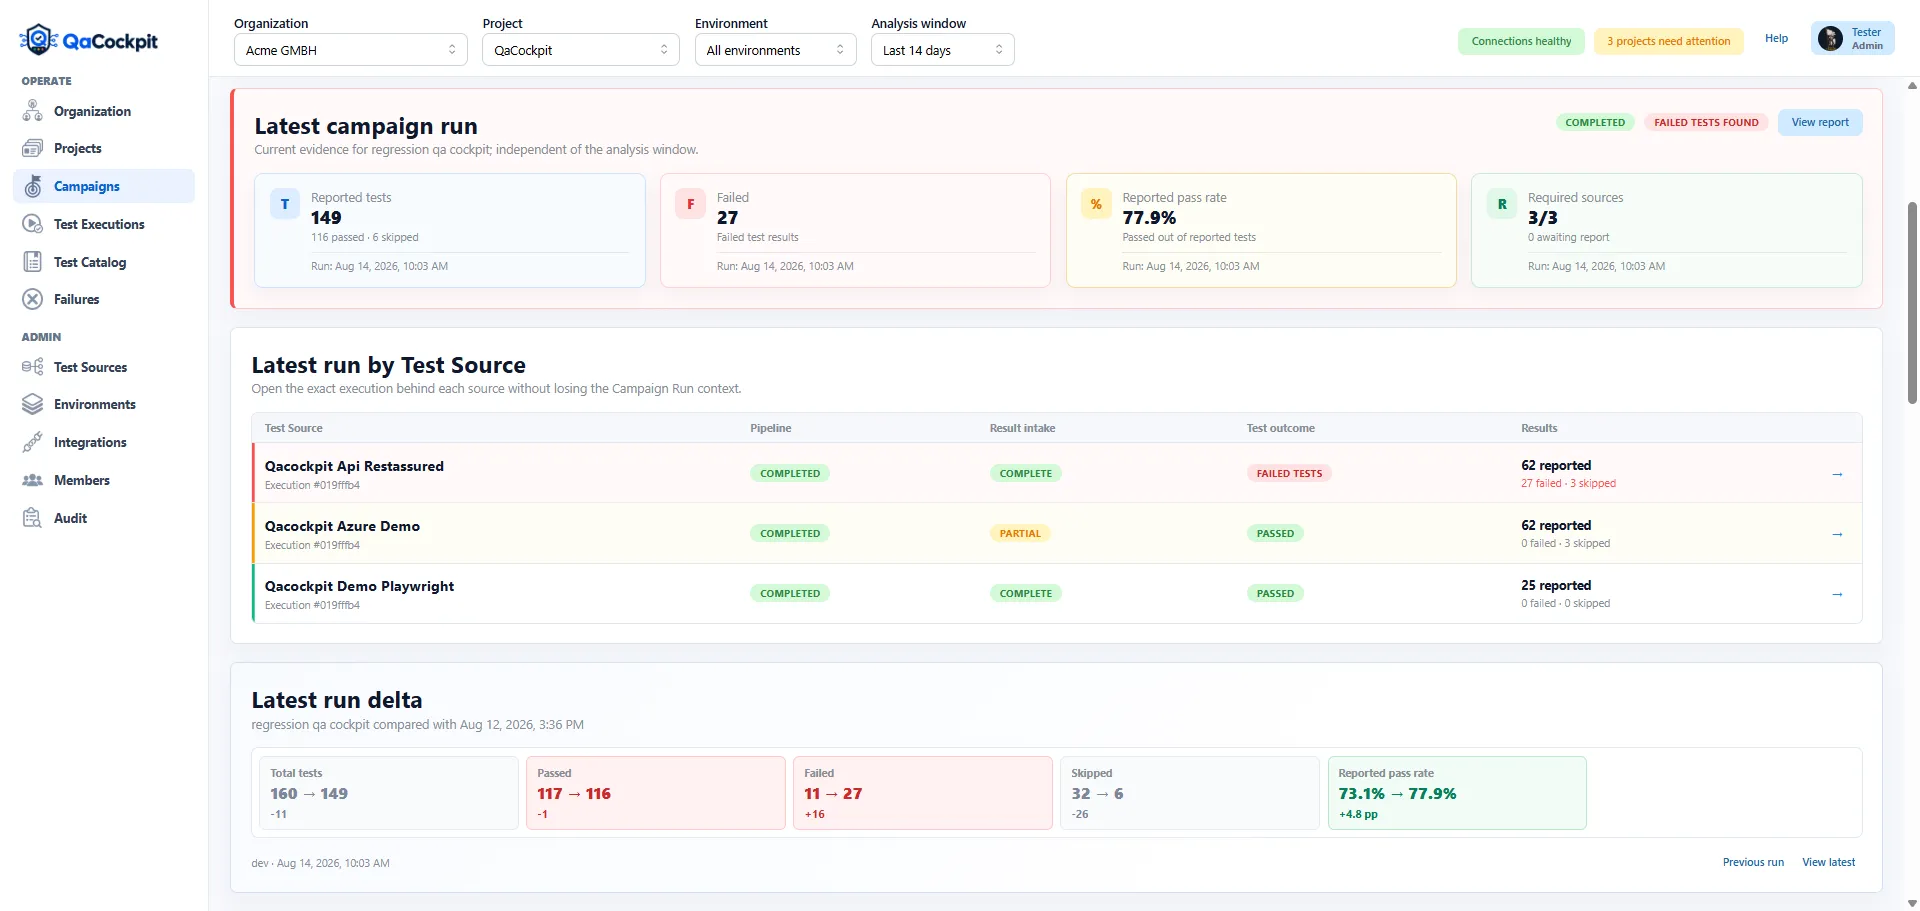
- the previous run reported 160 tests: 117 passed, 11 failed, and 32 skipped;
- the latest run reported 149 tests: 116 passed, 27 failed, and 6 skipped;
- the reported pass rate moved from 73.1% to 77.9%.
The percentage improved by 4.8 points. At the same time, one fewer test passed, 16 more tests failed, and the reported total fell by 11.
Nothing is wrong with the calculation. Passed / reported produces the displayed rate.
What changed is the composition of the denominator. The sharp reduction in skipped
results more than offsets the increase in failed results inside the percentage.
That does not prove the product became less reliable, either. Some previously skipped tests may have executed and exposed real failures. A suite may have disappeared from the report. Test data or environment conditions may have changed. The percentage alone cannot distinguish those explanations.
Reconstruct the denominator before judging the outcome
Every comparison should begin with scope, not color.
Ask whether the two reports represent the same intended campaign, Environment, Test Sources, and expected test set. Then compare the exact result counts:
- How many tests reported?
- How many passed, failed, or were skipped?
- Did expected tests disappear?
- Did every required source deliver a complete report?
- Are new failures concentrated in one source or spread across the campaign?
A stable pass rate with a shrinking result set may indicate missing evidence. A falling pass rate with a larger executed scope may reveal useful new coverage. The direction of the percentage is not enough to classify either change.
Read every Test Source, not only the campaign total
Campaign-level totals are a starting point. Source-level evidence explains the shape of the result.
One source may have completed its pipeline, delivered a complete report, and found failed tests. Another may show a passing test outcome but only partial result intake. A third may be fully complete and passing. Collapsing those situations into one campaign percentage removes the operational distinction the team needs next.
Pipeline lifecycle, result intake, and test outcome answer different questions:
- Did the provider workflow finish?
- Did the expected result evidence reach the TestOps record?
- What did the executed tests report?
A dependable review keeps all three visible.
Use the trend as context, not as a verdict
History helps the team see whether a movement is isolated or part of a pattern. Total, passed, failed, and skipped series reveal changes that a single pass-rate line hides.
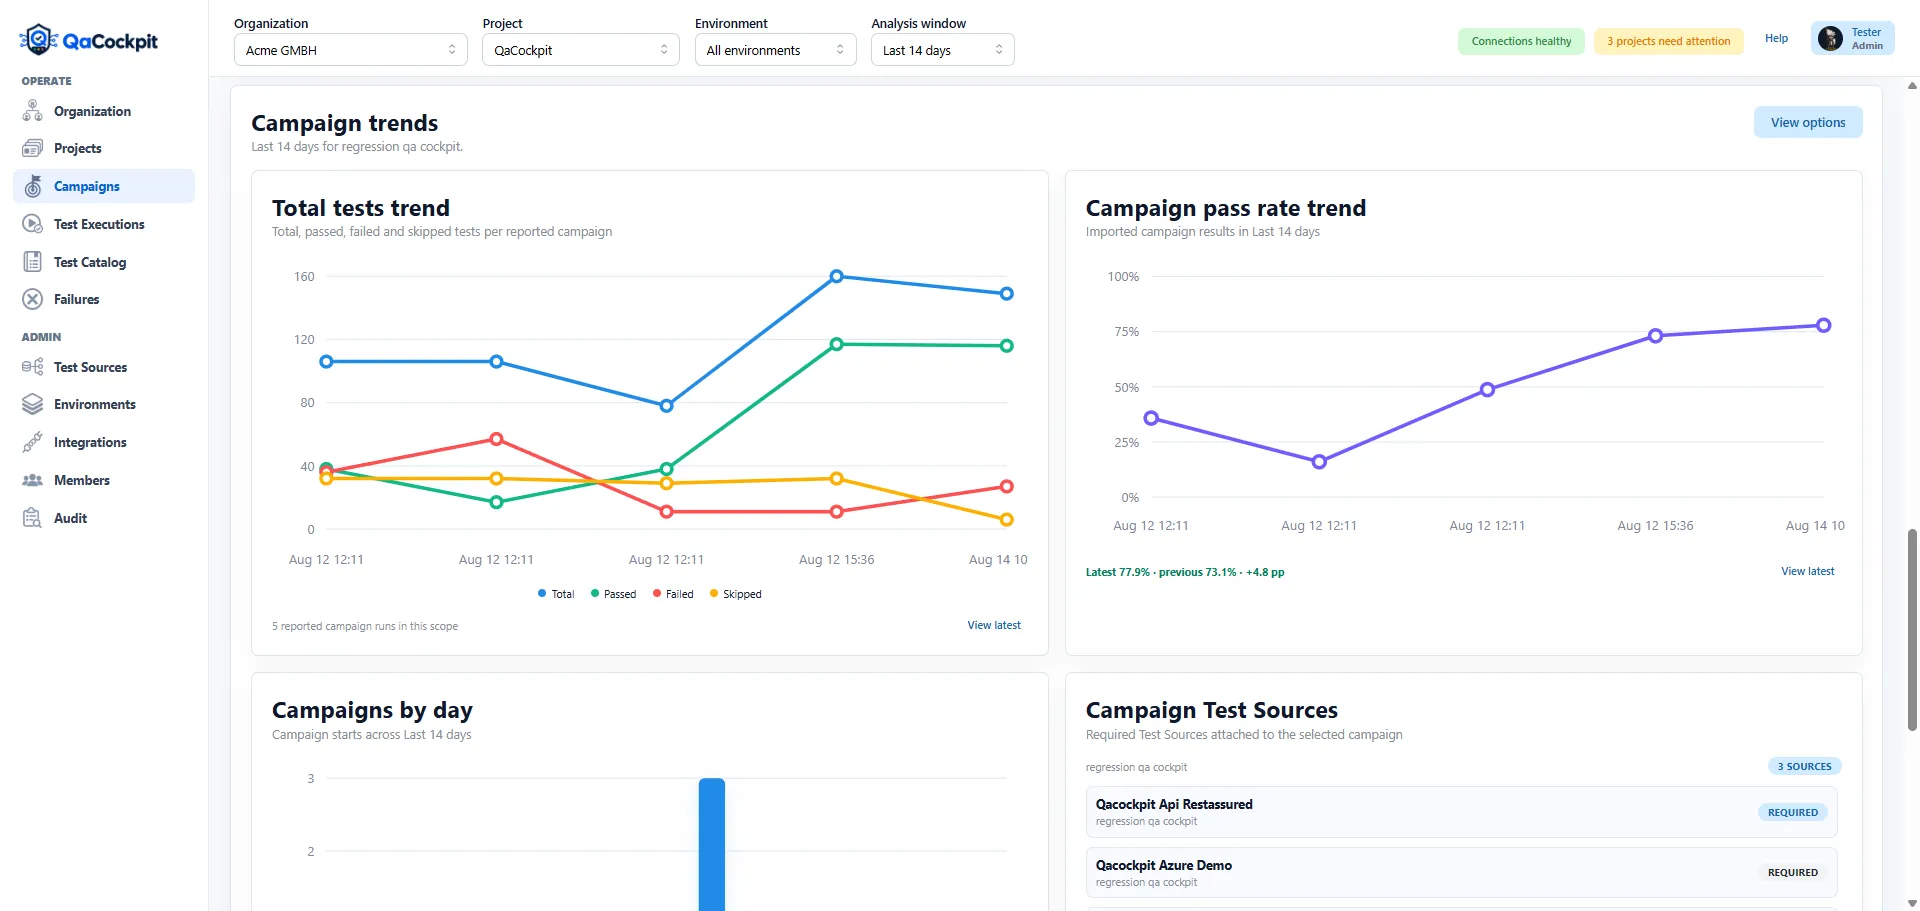
The exact latest-run delta should still sit beside the trend. Period charts can contain runs with different scope or timing, while the delta identifies the two concrete reports being compared. The chart shows direction; the report links preserve the evidence.
A practical campaign review sequence
A short, repeatable review prevents one attractive metric from closing the discussion too early:
- Confirm collection. Check that every required source reached a terminal state.
- Confirm result intake. Separate complete reports from partial or missing evidence.
- Compare reported and expected scope. Investigate added, removed, or missing tests.
- Compare exact outcome counts. Read passed, failed, skipped, and unknown totals before interpreting the rate.
- Find the source of movement. Open the Test Sources responsible for the delta.
- Inspect failure evidence. Use the exact execution, attempt, environment, failure cluster, and protected artifacts.
- Record the next action. Decide whether the change represents product risk, automation behavior, environment instability, or incomplete evidence.
This sequence does not make pass rate unimportant. It places the metric inside the operating context required to use it responsibly.
Use metrics to open investigation, not close it
Quality metrics are most valuable when they shorten the path to a better question. A pass rate can flag movement quickly. Scope, source-level evidence, and exact run comparison explain what the movement means.
The objective is not to find one perfect number. It is to preserve enough connected evidence that a team can understand the result without reconstructing several pipeline pages and spreadsheets.
QaCockpit Cloud keeps campaign totals, source-level lifecycle, result intake, test outcomes, and run-to-run deltas connected to the exact reports behind them. If your regression review still depends on one percentage and manual investigation, tell us how your current quality landscape works.