
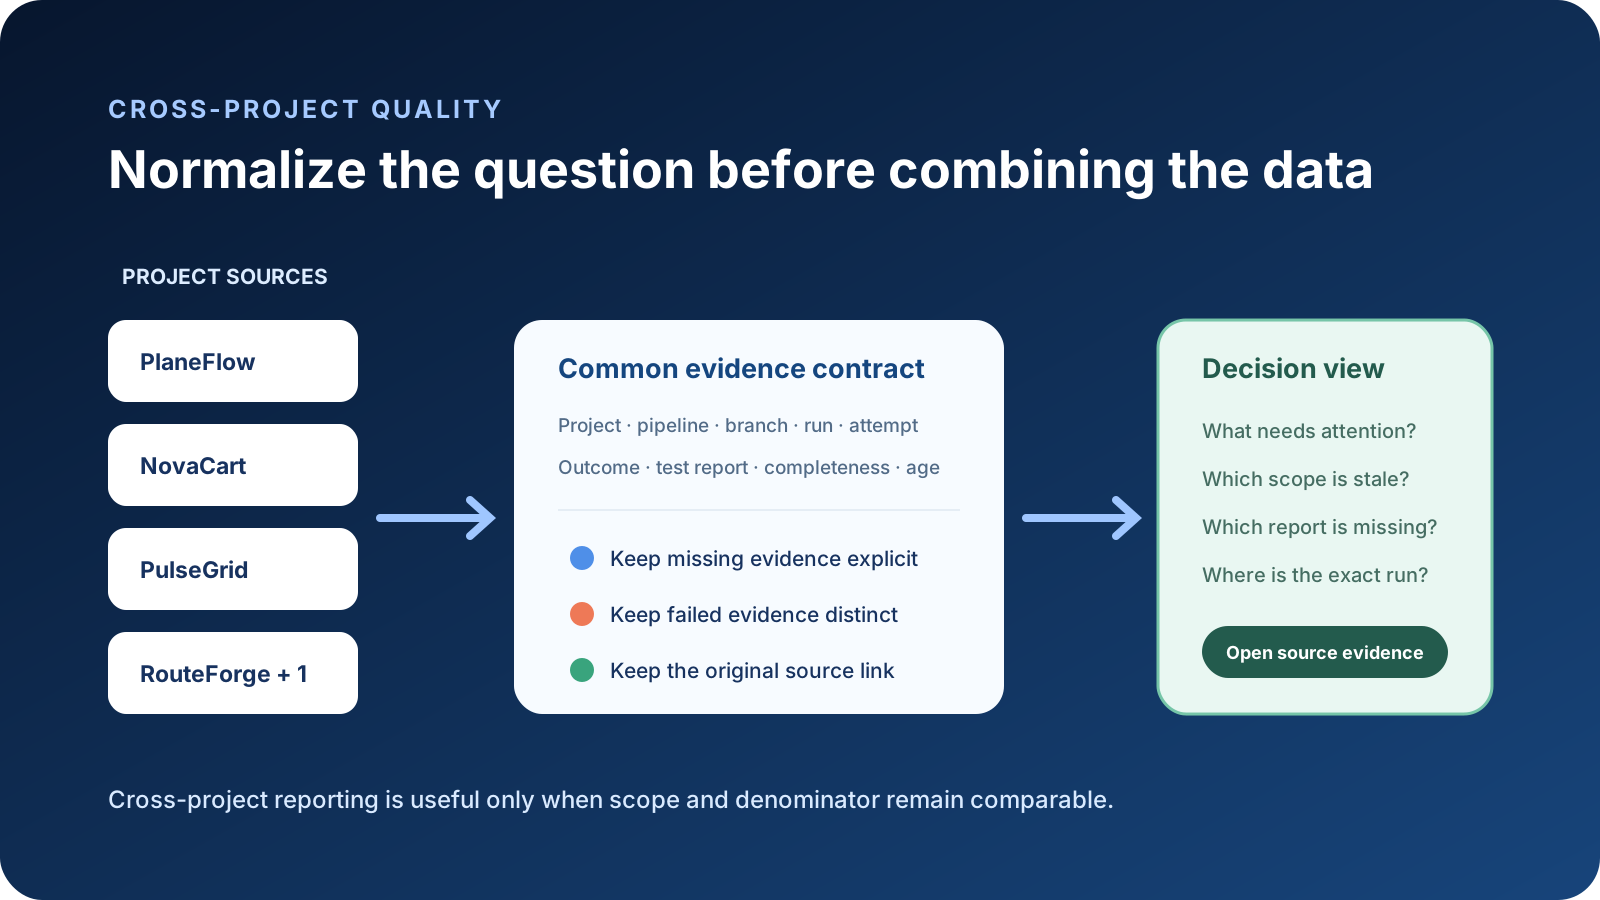
A cross-project quality view is not created by placing unrelated charts on one page. The first task is to define what can be compared across projects.
This tutorial starts with native Azure DevOps options. It then shows when a dedicated quality layer can reduce repeated setup without replacing Azure DevOps as the source of truth.
1. Define the decision and denominator
Suppose a release group contains five projects and 30 pipelines. Before choosing a tool, write down the review question:
Which projects lack current, complete, passing test evidence for the agreed release window, and where is the exact source run?
Now define each term:
- project — Azure DevOps project visible to the current user
- relevant pipeline — a pipeline intentionally included in this review
- current — evidence inside a stated time or candidate boundary
- complete — every expected report or shard for that source is present
- passing — the imported test outcomes meet the agreed gate
- source run — the exact run and attempt from which the evidence came
Do not use all pipeline activity as a substitute for a defined denominator. Build-only, deployment, scanning, and test pipelines serve different decisions.
2. Use cross-project work-item queries for Boards questions
Azure Boards queries can span projects in the same organization. That makes them useful for questions such as active release bugs, unowned defects, or blocked work items. Query-based dashboard widgets can then display a list, count, or chart built from the shared query.
Keep the query explicit:
- Include the intended Team Project conditions.
- Use shared queries when the dashboard is shared.
- Select stable fields and work-item states that mean the same thing across processes.
- Name the query with its scope and purpose, not only its chart style.
- Open representative results from every included project before trusting the count.
This path is for Boards data. It does not automatically combine pipeline test reports.
3. Know the dashboard widget boundary
Microsoft documents limited cross-project support for dashboard widgets. Burndown and Burnup can use data from other projects, and query-based widgets can reference queries that span projects. Other widgets remain scoped by their own configuration. See the cross-project FAQ.
Build a small configuration record beside the dashboard:
| Widget | Project or query | Pipeline or team | Branch | Window | Owner |
|---|---|---|---|---|---|
| Active release defects | Shared cross-project query | Release group | N/A | Current | Release QA |
| Build history | PlaneFlow | QC 01 QA Green | main | Last 10 | DevOps |
| Test trend | NovaCart | Checkout regression | main | 14 days | QA Lead |
That record is not bureaucracy. It is the meaning of the screen.
4. Use Analytics and Power BI when the report is broader
Azure DevOps Analytics and Power BI support broader reporting, but the connection method matters. Analytics views provide a convenient filtered model for Boards work items. The current Microsoft documentation says these views do not support pipelines; for other data, OData and other reporting paths are required. See Analytics views and the Power BI integration overview.
Use this route when you need:
- a governed management report across many projects
- calculations not available in dashboard widgets
- a longer historical model with controlled refresh
- a presentation that combines Azure DevOps with another authorized data source
Define refresh time, permissions, source queries, and the meaning of every calculated measure. A beautiful Power BI report can still compare incompatible scopes.
5. Treat pipeline tests as evidence, not work items
For automated testing, start from the published test results attached to exact pipeline runs. Azure DevOps provides the Tests tab, result details, history, filters, failure messages, stack traces, and attachments when the pipeline publishes suitable results. Microsoft’s review test results guide describes these native diagnostic paths.
A cross-project summary should retain at least:
- project and pipeline identity
- source branch and commit where available
- run and attempt
- pipeline lifecycle result
- structured test-result state
- test outcomes and report completeness
- collection time and evidence age
- source URL
Do not convert no published results to zero failed tests. It is unknown or missing
evidence until the pipeline’s contract says otherwise.
6. Decide who owns inclusion
The hardest cross-project question is often not technical: who decides which pipelines belong to the review?
Create a maintained source list. Each entry should state business purpose, project, pipeline, expected cadence, report format, owner, and when its evidence becomes stale. Review renamed or retired pipelines. Keep intentionally excluded work separate from required-but-missing work.
For five projects and 30 pipelines, a useful first release view might include only the eight sources that actually produce release evidence. Adding every job makes activity more complete while making the decision less clear.
7. Add a quality layer only when the repeated work justifies it
QaCockpit’s public Azure DevOps edition provides My views and Quality Board for users who need repeatable project and quality scopes across accessible Azure DevOps data.
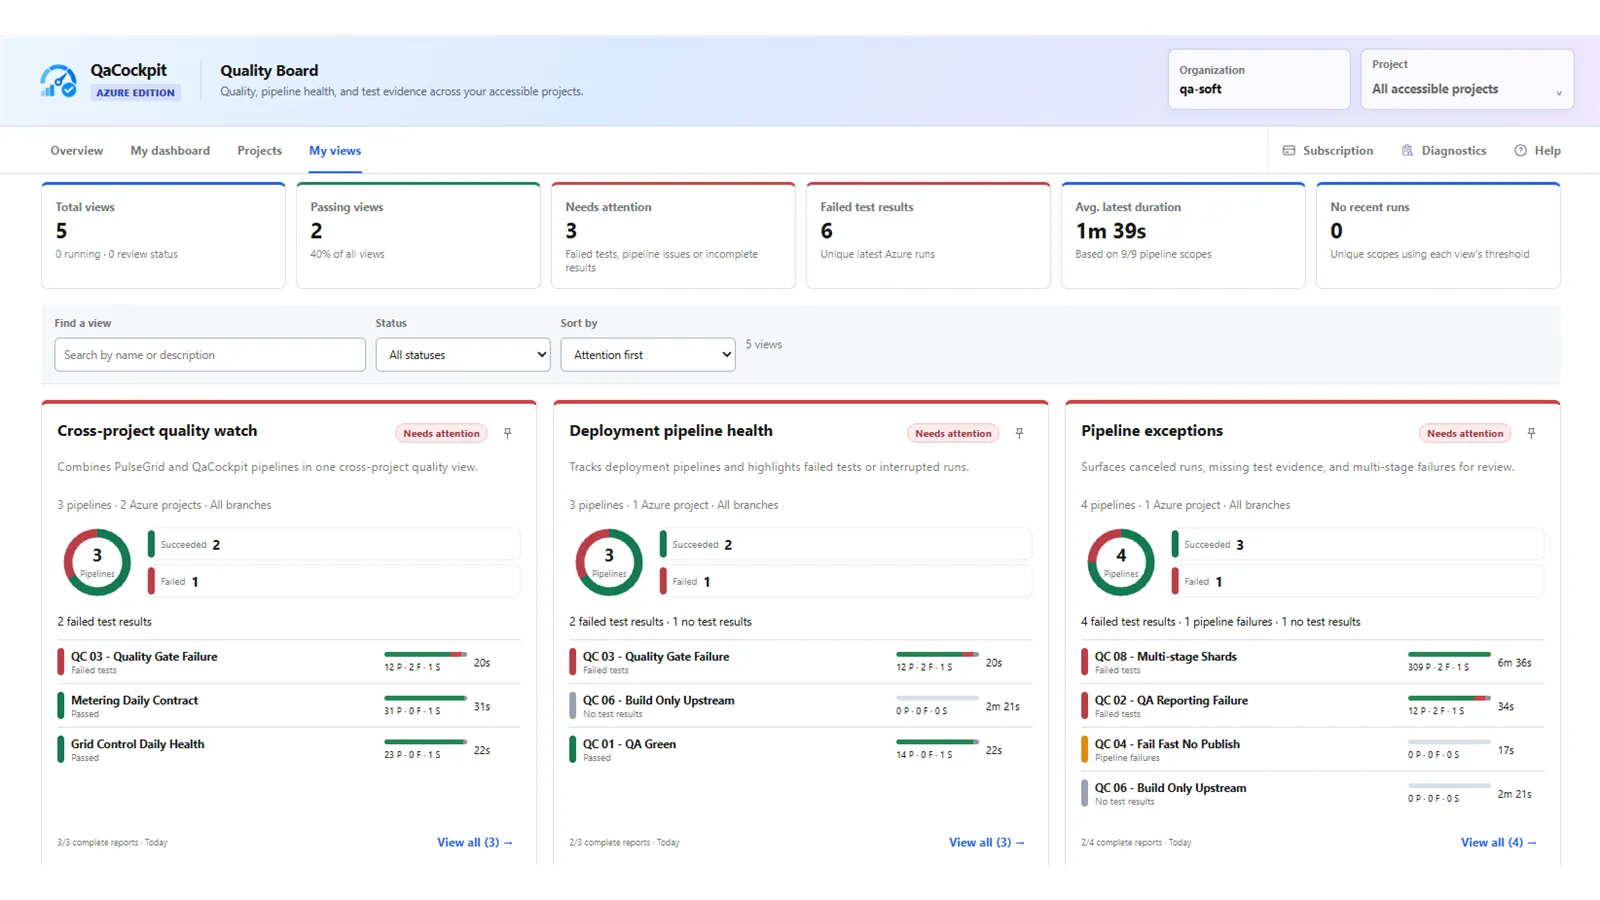
Pilot screenshot using synthetic qa-soft data, captured 29 October 2026 from
extension 0.0.121. Public capability claims in this tutorial remain limited to
QaCockpit for Azure DevOps 1.3.0.
This can reduce repeated configuration when multiple reviewers ask the same questions about project health, pipeline evidence, freshness, and current failures. It does not replace native Azure permissions, pipeline timelines, work-item queries, or Power BI. The signed-in user’s access remains the boundary.
A practical selection checklist
Use the smallest option that answers the question:
- One project and a known team audience: start with a native dashboard.
- Cross-project Boards work: use a shared cross-project query and query widgets.
- Governed historical management reporting: evaluate Analytics, OData, and Power BI.
- Repeatable quality-evidence triage: consider a dedicated quality view with source links.
- Root-cause diagnosis: always return to the exact pipeline, test result, logs, and attachments.
Before calling the result complete, ask another authorized user to identify the project scope, denominator, last refresh, missing-evidence rule, and source link. If any answer is hidden in the builder’s memory, the report needs one more round of clarification.
The objective is not one screen containing everything. It is one dependable route from a cross-project signal to the evidence and owner needed for the next decision.