
Azure DevOps dashboards are good at collecting useful project information in one place. They are also easy to fill with widgets that look important but do not help anyone make a decision.
Both statements can be true. The difference is rarely the number of charts. It is whether the dashboard has a clear audience, a stable scope, and a path from a signal to the exact evidence behind it.
This guide gives native Azure DevOps dashboards fair credit, then shows a practical test for recognizing when a dashboard has become decoration rather than an operating tool.
What Azure DevOps dashboards do well
Azure DevOps provides a broad catalog of widgets across Boards, Repos, Pipelines, and Test Plans. The catalog includes query results, build history, deployment status, requirements quality, and test-result trends. Microsoft describes dashboards as customizable project or team signboards that combine charts and widgets with live links to the underlying services. See the current dashboard overview and widget catalog.
That makes a native dashboard a strong choice when a team needs to:
- combine work progress, pull requests, builds, and tests for one project
- use a shared work-item query as the denominator for a chart or list
- show one or more pipeline trends without introducing another reporting product
- give a known audience shortcuts to Azure DevOps views they already understand
- let project contributors adjust the layout as the team’s operating rhythm changes
The dashboard also keeps the drill-down inside Azure DevOps. A build-history bar can open the exact run. A query widget can open the matching work items. A test widget can lead to test evidence. That source connection is more valuable than a screenshot exported to a slide deck.
Configuration is part of the meaning
A widget title alone does not define its scope. Two tiles called Failed tests might use
different pipelines, branches, time windows, or result populations. A query chart may be
based on one team’s area paths while the dashboard title suggests an entire program.
Before relying on a dashboard, write down five things:
| Question | Example answer |
|---|---|
| Who uses it? | Release QA and Engineering Manager |
| What decision does it support? | Whether to continue release investigation |
| Which scope is included? | PlaneFlow project, default branch, last 24 hours |
| What counts as missing? | Required pipeline has no complete test report |
| Where does each signal lead? | Exact query, run, test result, or work item |
If those answers live only in the original author’s memory, another viewer sees a composition, not a contract.
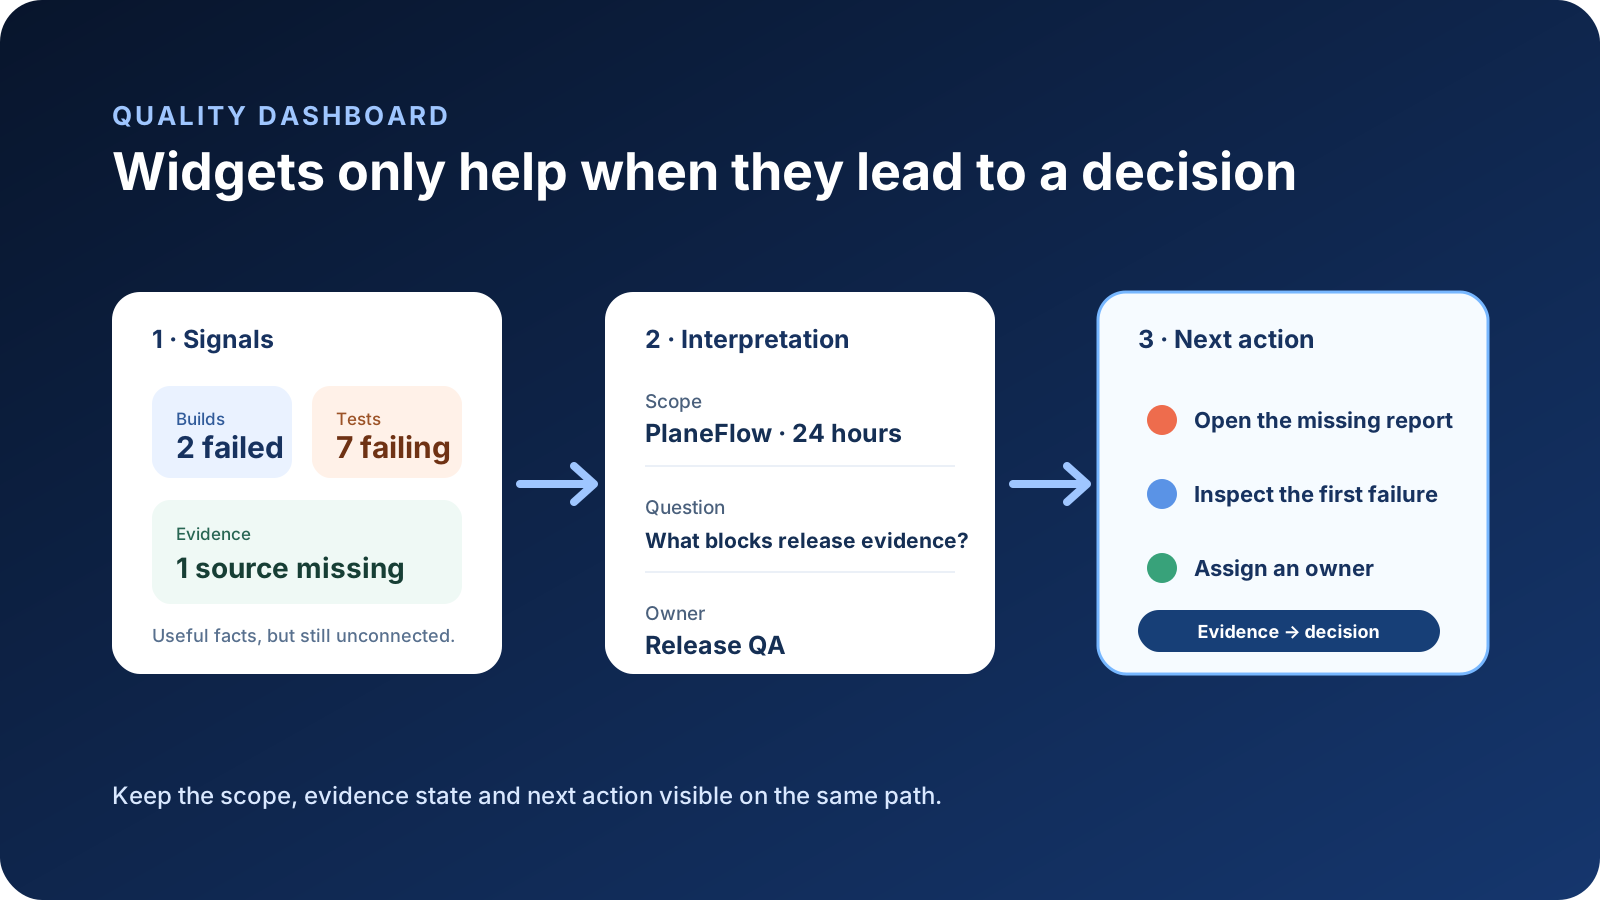
Why a dashboard can stop helping
In one practitioner’s experience, a team had dashboards but they gradually disappeared from daily conversations. That is an anecdote, not evidence that Azure DevOps dashboards are generally abandoned. It does expose four common failure modes worth checking.
1. The dashboard has no recurring decision
A dashboard created for a launch may remain visible after the launch. A collection made for a quarterly review may be too broad for a daily triage. Without an explicit review cadence or decision, nobody knows which signal deserves attention now.
2. The audience cannot interpret the configuration
An author may understand that a red query tile excludes accepted defects or that a test trend covers only one pipeline. A manager opening it later might reasonably read the headline more broadly. The problem is not lack of intelligence; the scope is hidden.
3. Ownership and maintenance are unclear
Queries are renamed, pipelines are replaced, teams change, and release branches move. A dashboard can remain visually healthy while its inputs no longer match the process it was meant to represent. Give the dashboard an owner and a review date.
4. The widgets do not form a path
Ten individually useful widgets can still force the reader to reconstruct the story. If a failed build, declining pass rate, and old result refer to different scopes, putting them next to each other does not create one quality conclusion.
Design around questions, not coverage of every service
Microsoft’s own guidance recommends choosing a dashboard focus and tuning it for a specific scenario. The practical consequence is restraint. Start with the questions a viewer must answer in the first minute:
- What changed or needs attention?
- Which project, pipeline, branch, and time window does the signal describe?
- Is the test evidence complete, failed, stale, or absent?
- Who is expected to act?
- Which exact Azure DevOps page contains the source evidence?
Add a widget only when it shortens one of those paths. If it cannot lead to evidence or an action, a sentence or link may be better.
Use native options before adding another layer
For work tracking, shared queries and query-based charts are usually the simplest start. For pipeline health, use the exact run, native pipeline reports, and test-result views. For longer-term or custom reporting, Azure Analytics and Power BI can provide more control. A dashboard does not need to become a general-purpose data warehouse.
Cross-project needs require more care. Microsoft documents limited support for widgets from different projects, while work-item queries and Analytics or Power BI can span projects under defined conditions. Do not imply organization-wide coverage because one widget happens to select more than one team. See the cross-project FAQ.
When an opinionated quality view helps
An additional quality view is useful when the team repeatedly rebuilds the same interpretation layer: project health, pipeline evidence, missing test reports, freshness, current failures, and links back to exact Azure runs.
QaCockpit’s public Azure DevOps edition provides Quality Board and related quality views for that purpose. It does not replace Azure Boards, native dashboards, pipeline logs, or Test Plans. It applies a fixed quality model to evidence the signed-in user can access, then links back to Azure DevOps for the source detail.
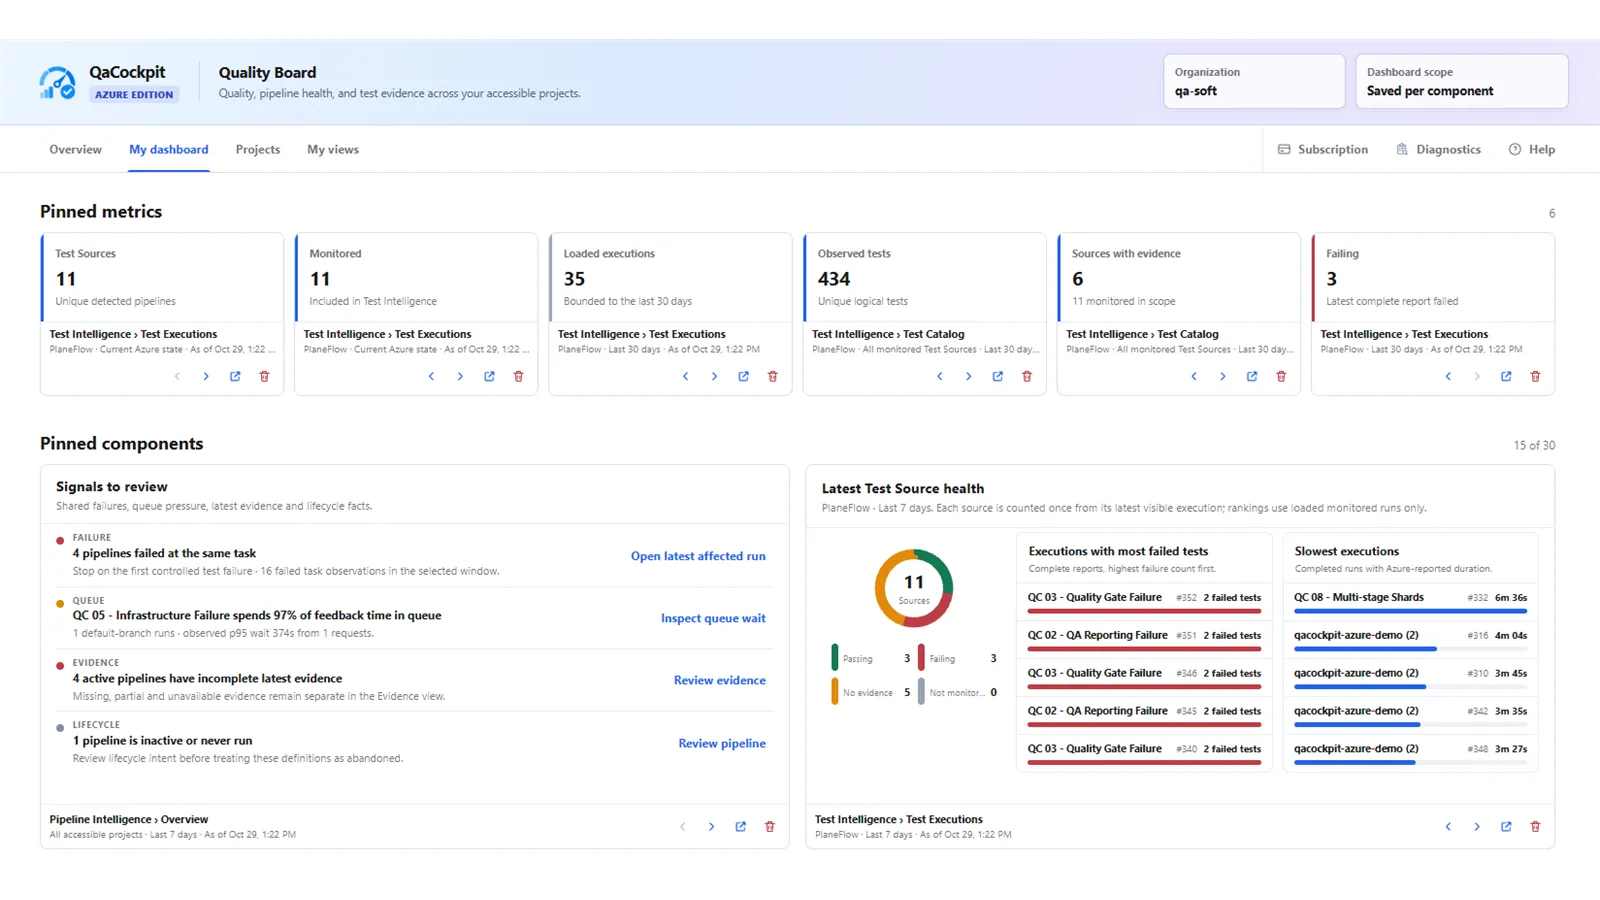
Pilot screenshot using synthetic qa-soft data, captured 29 October 2026 from
extension 0.0.121. Public capability claims in this guide remain limited to QaCockpit
for Azure DevOps 1.3.0.
The tradeoff is intentional. A native dashboard is more configurable. An opinionated quality board is faster to interpret only if its model matches the decision you need to make. Use both when their responsibilities are clear.
A five-question dashboard review
Use this as a static exercise during a retrospective or dashboard cleanup:
- How often did someone use this dashboard to make a decision in the last month?
- Can a new viewer state its project, branch, and time scope without opening settings?
- Does every warning lead to the exact evidence or owner?
- Which widget would somebody notice if it silently became stale?
- What would the team lose if the dashboard disappeared tomorrow?
Do not treat a small internal poll as industry research. Report the number and roles of
respondents, allow people to skip questions, and keep View results without voting if an
interactive version is added later.
The useful outcome is not “dashboards are good” or “dashboards are bad.” It is a smaller, owned surface whose signals preserve scope and lead to a defensible next action.