
Comparing Azure DevOps dashboards with QaCockpit by counting tiles would be misleading. The products start from different jobs.
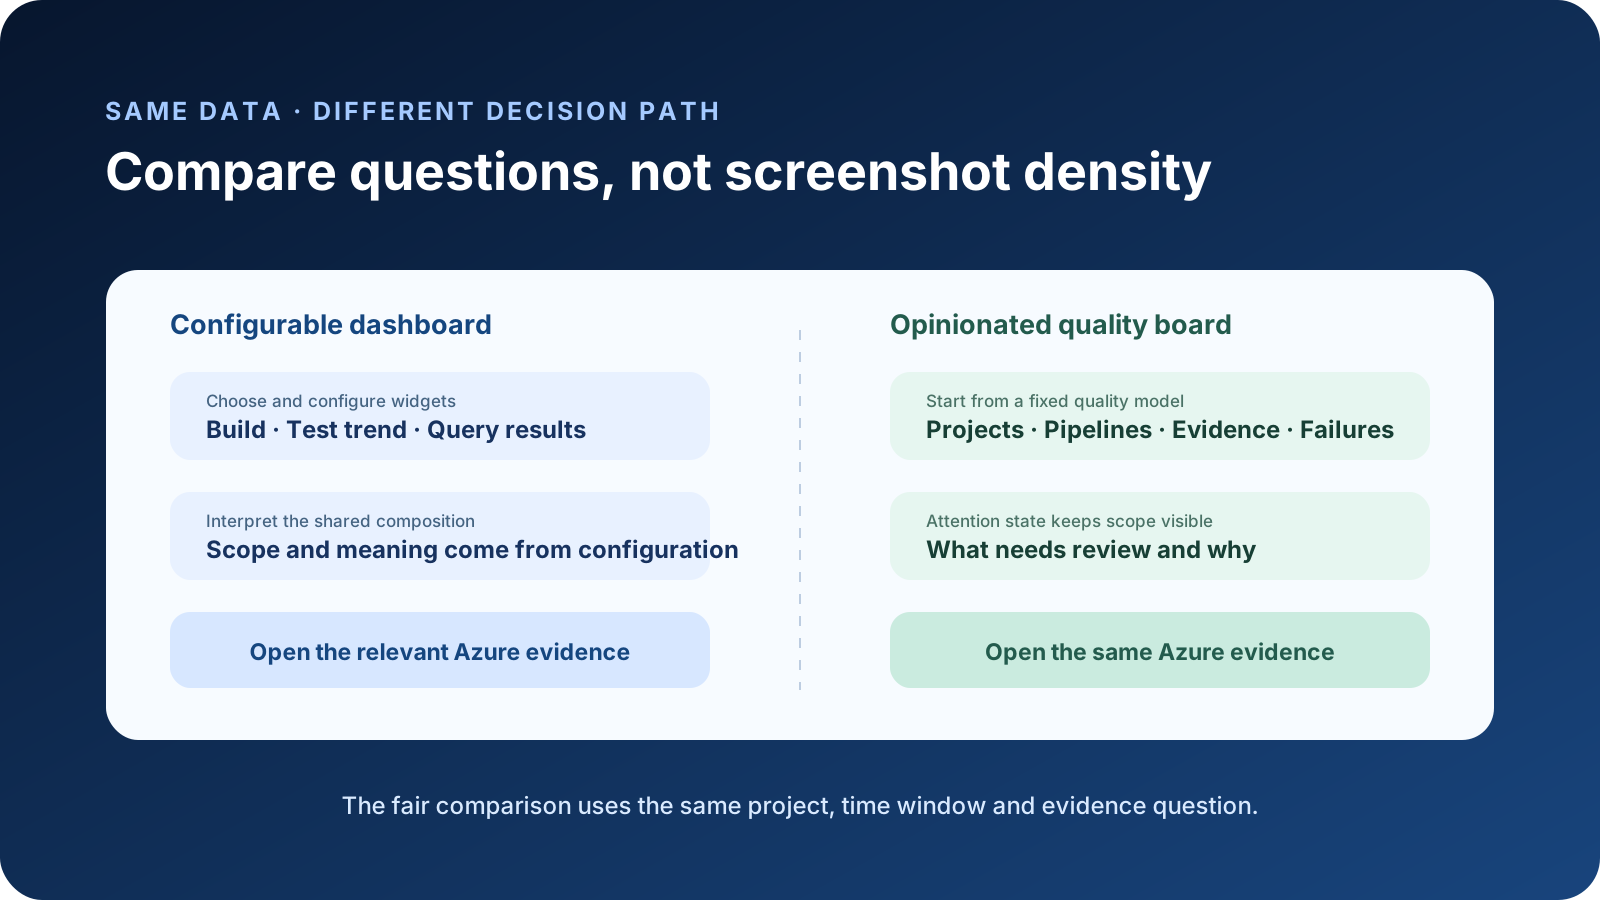
Azure DevOps dashboards are configurable canvases. QaCockpit Quality Board is an opinionated quality view inside Azure DevOps. A fair comparison gives both tools the same data, audience, time window, and question, then measures how clearly each supports the next decision.
The shared scenario
Use a synthetic organization with five projects and 30 pipelines. For the comparison day, assume:
- two pipelines failed
- one successful pipeline published no complete test evidence
- seven tests failed across two projects
- one project has only stale evidence
- one recurring failure needs investigation
The audience is a QA Lead preparing a release review. The first-minute questions are:
- Which project needs attention first?
- Is the signal a failed pipeline, failed tests, missing evidence, or old evidence?
- Which exact Azure run or test result should be opened next?
Do not change the data set between screenshots. Do not give one tool a 24-hour scope and the other a 30-day trend. The comparison fails if the denominator moves.
Native Azure DevOps dashboard path
Azure DevOps has useful building blocks for this scenario. The current widget catalog includes build history, deployment status, query results, requirements quality, and test result trends. Widgets can open their source views, and teams can arrange dashboards for their own operating rhythm. See Microsoft’s widget catalog.
A capable team can create a release-quality dashboard with:
- build-history widgets for selected pipelines
- test-results trend widgets for selected builds
- query tiles for owned defects or release work
- Markdown instructions that define scope and review cadence
- links to the exact test, run, or analytics view used for diagnosis
Its strength is flexibility. The same canvas can mix delivery, work tracking, tests, and team context. Its cost is that configuration becomes part of the operating model. Someone must select the inputs, document the meaning, maintain the layout, and teach viewers how the pieces relate.
Cross-project composition also has boundaries. Microsoft documents limited support for adding widgets from other projects, while cross-project work-item queries and broader Analytics or Power BI reporting are available for some needs. The dashboard title alone does not make every widget organization-wide. See the cross-project FAQ.
QaCockpit Quality Board path
QaCockpit uses a fixed model for project health, pipeline activity, test-evidence state, current failures, personal views, and campaign context. Its public Azure DevOps edition does not replace the underlying Azure pages. It organizes signals and sends the user back to the exact source for diagnosis.
For the synthetic day, the first view should make four distinctions explicit:
- pipeline failed
- pipeline succeeded but test evidence is missing or incomplete
- complete evidence contains failed tests
- available evidence is stale for the intended decision
Those states should not collapse into one red score. The viewer needs to know why a project needs attention and which source produced the signal.
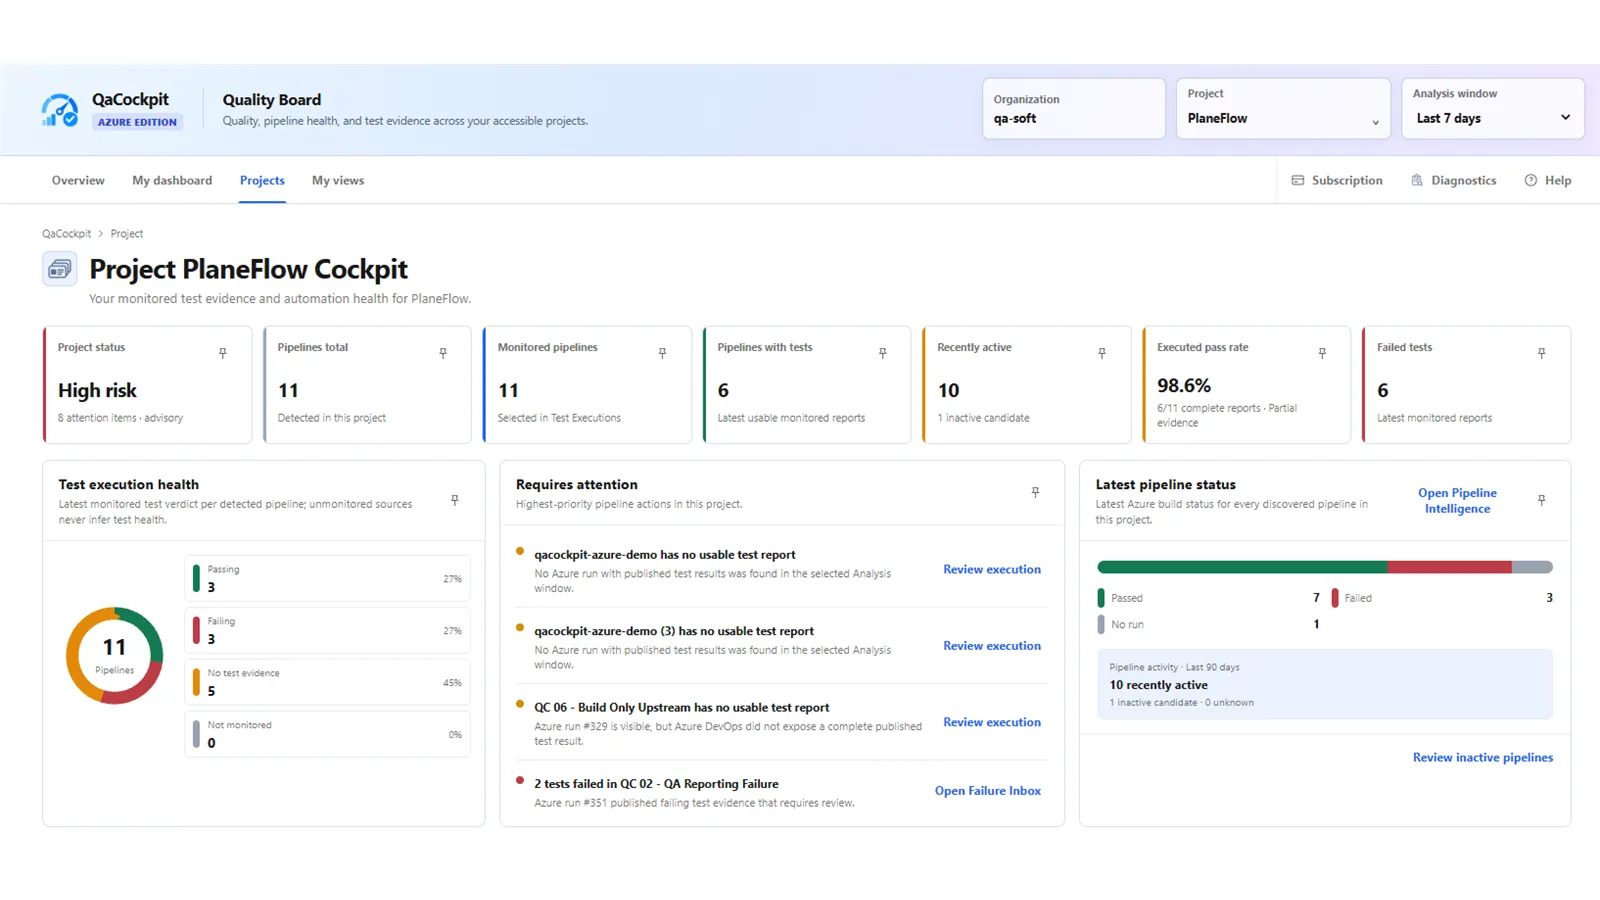
Pilot screenshot using synthetic qa-soft and PlaneFlow data, captured 29 October
2026 from extension 0.0.121. Projects is intentionally a project-scoped cockpit; public
capability claims in this comparison remain limited to QaCockpit for Azure DevOps 1.3.0.
The fixed model reduces setup and interpretation work. It also limits customization. QaCockpit is not the better surface for sprint burndown, pull-request queues, or a custom executive KPI that combines unrelated business systems. A native dashboard or Power BI report may be the correct tool for those jobs.
Decision-by-decision comparison
| Decision | Native dashboard | QaCockpit quality view |
|---|---|---|
| What should I watch? | Team selects and configures widgets | Product provides a quality-focused model |
| What is the scope? | Depends on every widget’s configuration | Project, time, and evidence scope are part of the view |
| What is missing? | Must be modeled in queries or chosen widgets | Missing or incomplete test evidence is a distinct signal |
| Can I mix delivery and work tracking? | Yes; this is a native strength | Only where it supports the quality model |
| Where is diagnosis performed? | Exact Azure DevOps source view | Exact Azure DevOps source view via drill-down |
| Who maintains the composition? | Dashboard owner or team | Product model plus the user’s saved scope |
This is not a speed benchmark. A well-designed native dashboard can answer the questions quickly. A badly scoped quality product can obscure them. The test is whether a new, authorized viewer can explain the signal without reverse-engineering hidden assumptions.
What neither screen proves
Neither dashboard can prove a root cause from a high-level pattern. Several failed pipelines may share an environment problem, or they may have unrelated defects. A green rerun may reflect a repaired condition, an unstable test, different data, or luck. A missing report may come from a skipped test command, failed publishing, permissions, or an intentionally out-of-scope run.
The overview should route investigation. Root-cause work still belongs in run timelines, logs, test results, attachments, configuration, and team context.
Microsoft’s test-results guidance describes the native Tests tab, history, details, and attachments available for that work. A comparison that ignores these native diagnostic capabilities is not fair.
Keep future product work out of the comparison
The comparison should use capabilities in the public QaCockpit Azure DevOps release only. Private traceability pilots, future automatic classification, estimated savings, and roadmap ideas are not public product claims. If a desired decision requires one of those capabilities, label it as a gap instead of implying it is available.
Likewise, the current Quality Board does not approve a release or infer the correct test scope. It organizes accessible evidence. The release owner still decides what evidence is required and whether the remaining uncertainty is acceptable.
The 30-second attention exercise
Show both screens without annotations and ask three people to answer:
- What would you investigate first?
- What scope do you think the signal covers?
- Where would you click to verify it?
Record the answer and time, not just a preference. Then reveal the intended scope and source evidence. A response is useful when it exposes a mismatch between the screen’s design and the audience’s interpretation. It is not a representative product study.
Choose Azure DevOps dashboards when you need a flexible team canvas and are willing to own its configuration. Add an opinionated quality view when teams repeatedly need the same evidence distinctions across projects. In both cases, keep the source link and the scope visible. The goal is a better decision, not a denser screen.