
Pass rate is one of the most common quality metrics. It is easy to calculate, easy to compare, and useful for understanding the observed outcome of a test run.
It is not enough to explain how efficiently a team handles quality problems.
Two teams can have the same pass rate and very different operational performance. One may diagnose failures in minutes with complete evidence and clear ownership. The other may spend hours locating the correct run, reproducing context, and deciding who should investigate.
That difference is visible in time to diagnosis.
Define the metric around a real operating loop
Time to diagnosis should not mean time until every defect is fixed. It measures the distance between a meaningful failure signal and a focused, owned understanding of what happened.
A practical first definition can use milestones such as:
- A failed or errored result is imported.
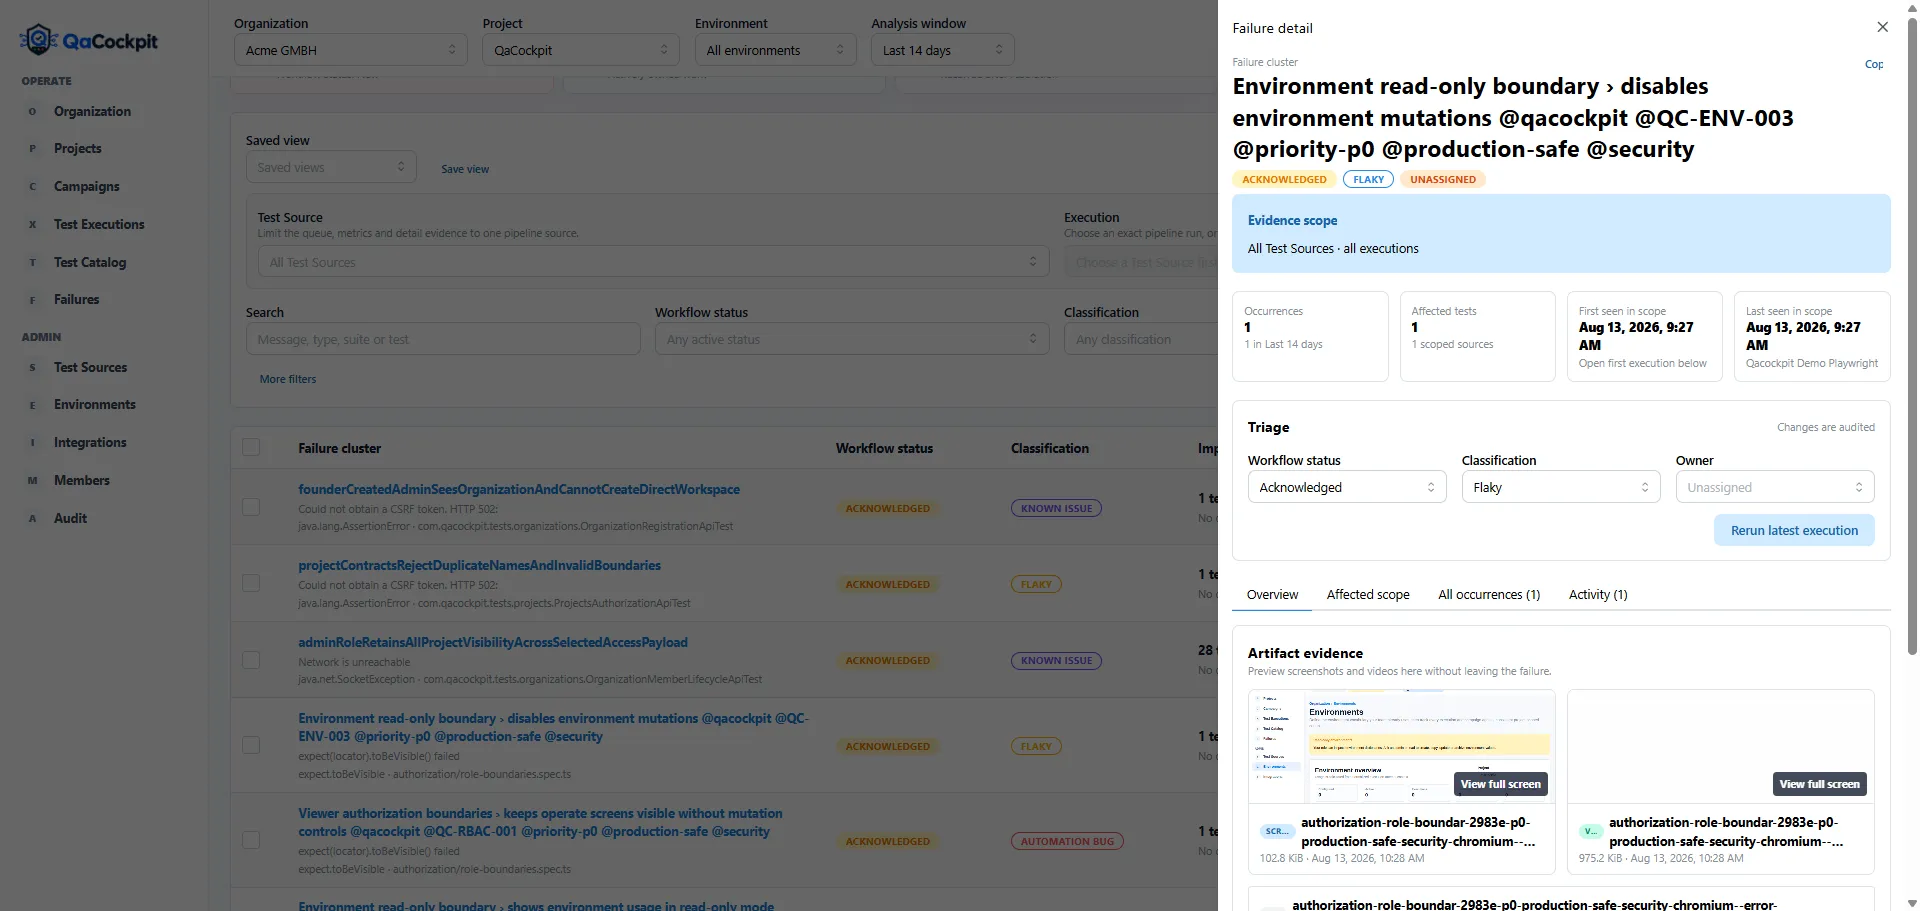
- The failure is connected to execution context and evidence.
- Similar occurrences are recognized as one cluster.
- An owner or responsible team acknowledges the issue.
- The problem is classified well enough to choose the next action.
The final resolution may take days. The diagnosis should not remain ambiguous for that long.
Why pass rate can hide operational friction
A 97% pass rate may look healthy, but the remaining failures can have very different effects:
- three known failures with clear owners;
- three new product defects blocking a release;
- three duplicate occurrences of one environment outage;
- three unstable tests that consume rerun time every day;
- three failures with missing logs and no reproducible context.
The percentage is the same. The quality work is not.
Pass rate should remain part of the picture, but it needs context from completeness, failure history, ownership, and diagnosis flow.
Start by removing reconstruction time
Before optimizing a sophisticated metric, reduce the manual steps required to understand one failure.
The diagnostic record should connect:
- test and technical implementation;
- Test Source, repository, framework, and suite;
- branch, commit, environment, provider run, and attempt;
- failure message, stack, stdout or stderr;
- screenshots, logs, traces, video, or other protected evidence;
- related occurrences and earlier activity;
- workflow status, classification, and owner.
When this information is already connected, the team can spend more time on the cause and less time rebuilding the story.
Group repeated evidence before counting work
Counting individual failed test results can exaggerate the number of independent problems. Ten occurrences may represent one shared service outage or the same automation defect repeated across environments.
Deterministic failure clustering is a useful first step. It does not need an opaque model to provide value. A transparent fingerprint based on normalized failure type, message, and stack can create a stable investigation unit while preserving every exact occurrence.
The team then measures the lifecycle of the problem, not only the number of red rows.
Look for diagnosis bottlenecks
Once the flow is visible, several useful operational questions emerge:
- How long do new failures wait before acknowledgement?
- Which Test Sources produce the most failures without useful evidence?
- Which classifications repeatedly require manual investigation?
- How often does a rerun replace diagnosis rather than support it?
- Which active clusters have no owner?
- Where do issues return after being marked resolved?
These signals point to improvements in automation, environment stability, evidence collection, or team ownership.
Use the metric to improve the system, not judge individuals
Time to diagnosis is a process metric. It should expose friction in tools, evidence, and handoffs—not become a leaderboard for engineers.
If a team diagnoses slowly because artifacts are missing or ownership is unclear, the right response is to improve the quality operation. The goal is a faster shared understanding, not pressure to close complex issues prematurely.
QaCockpit Cloud connects Failure Inbox with execution history, result evidence, ownership, and activity so diagnosis can become an observable operating loop. If your team still reconstructs this context manually, request a quality-landscape review.