
These guides cover the public Azure DevOps Marketplace extension, its current permissions, personal storage, evidence boundaries, and supported environment.
Looking for QaCockpit Cloud documentation?01
Start with the available pipeline history
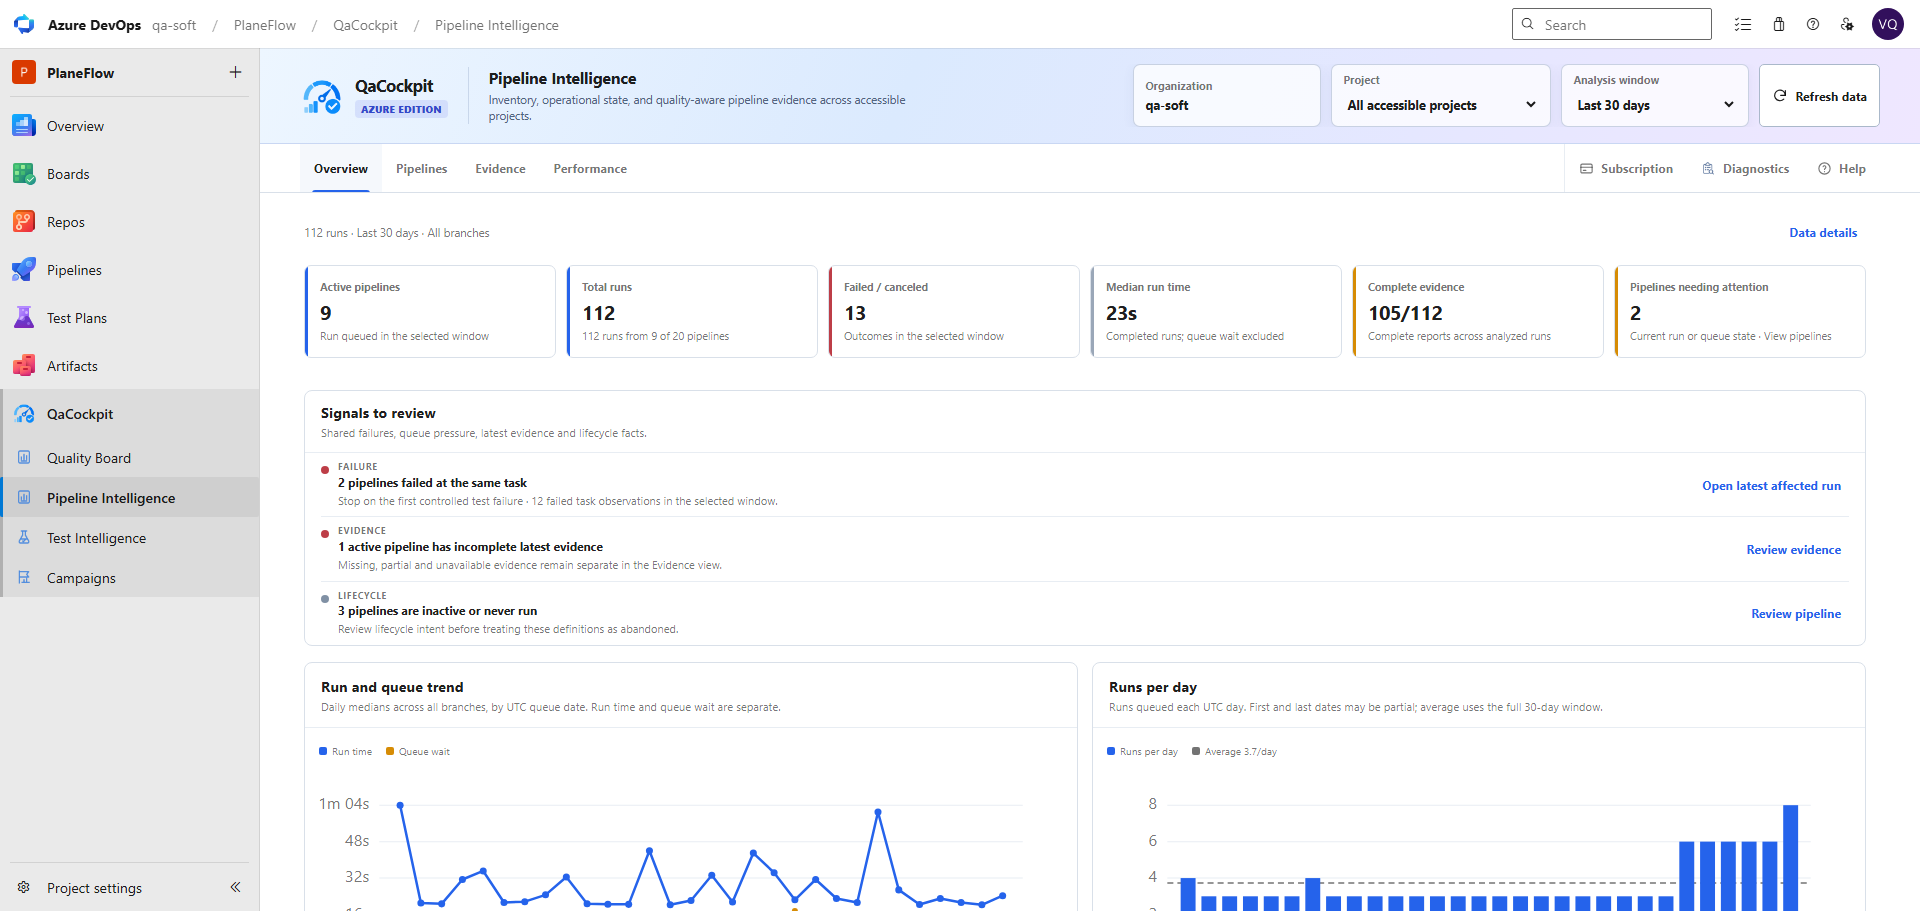
Choose all accessible projects or one project, then select 7, 14, or 30 days. Overview uses every accessible run queued in that window across all branches. It shows active definitions, outcomes, run-time median, report completeness, current operational attention, and daily activity without inventing a previous-period comparison.
Signals to review keep shared task failures, queue pressure, incomplete latest evidence, and inactive definitions separate. Each available action opens the affected pipeline, evidence view, or exact run.
02
Separate run time from queue wait and feedback time
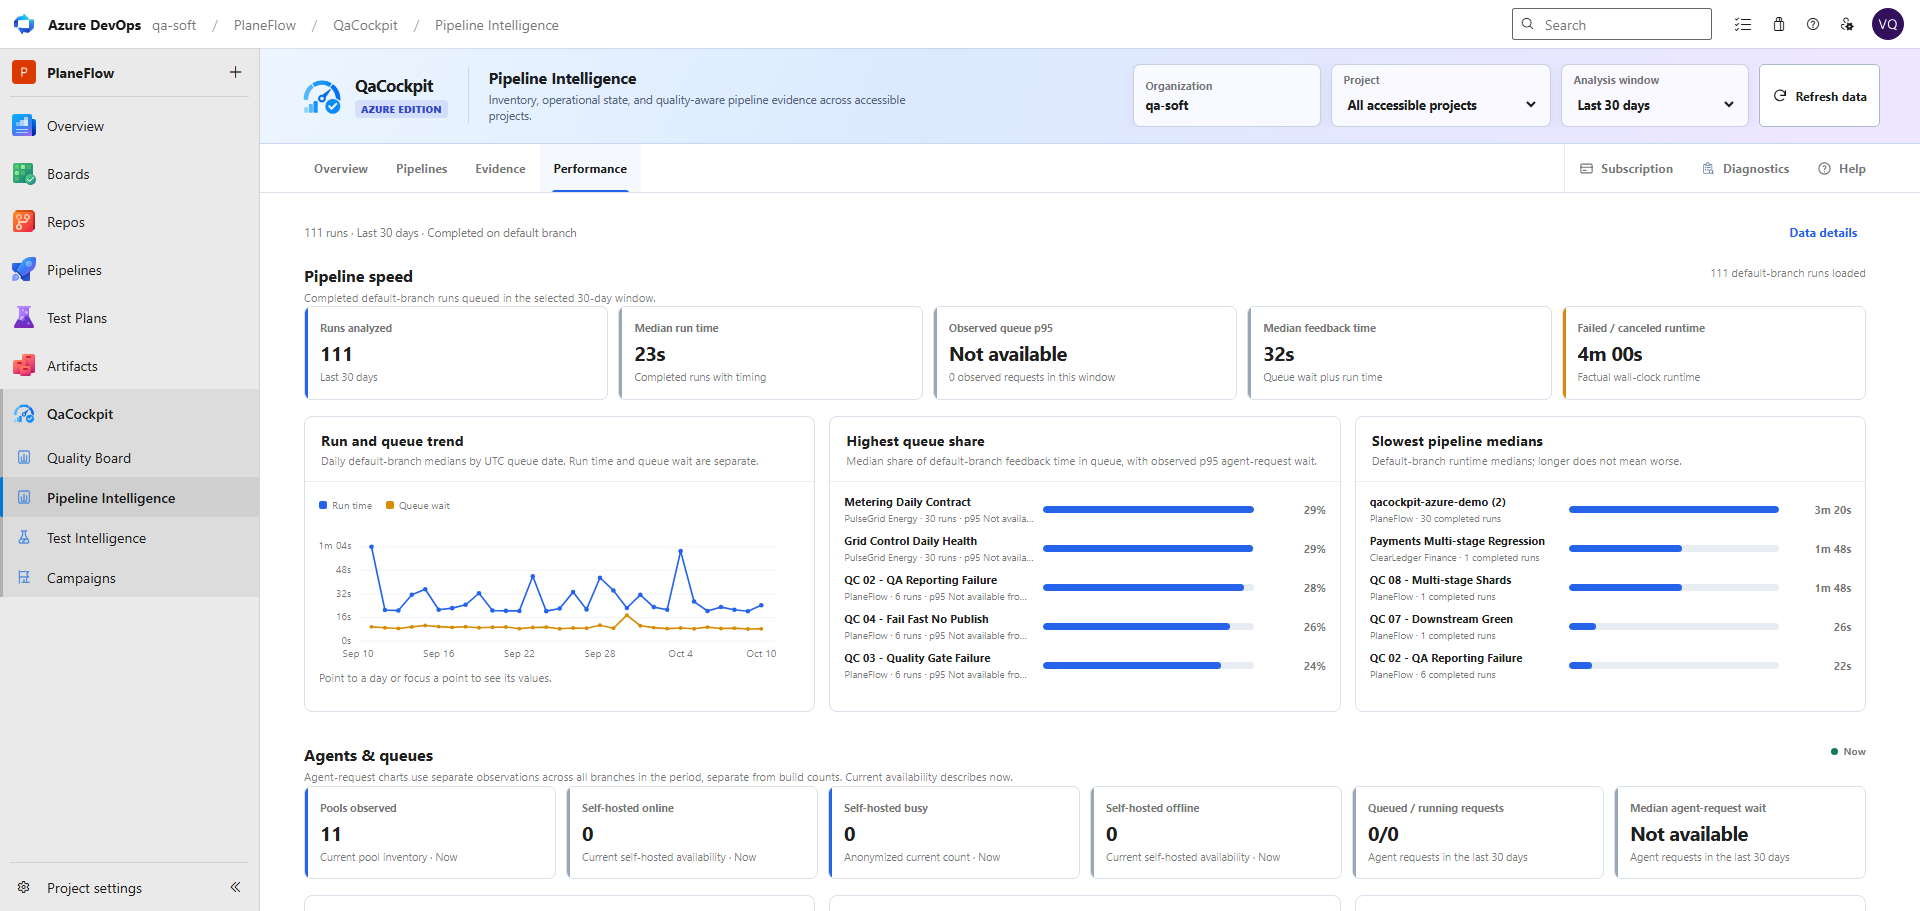
Performance uses completed default-branch runs queued in the selected window. Its run count can therefore be lower than Overview. Daily medians keep run time and queue wait separate, while feedback time covers the interval from queue to finish.
Highest queue share and slowest pipeline medians show at most five facts and state the total when more are available. A longer run is a measured fact, not an automatic quality verdict. Failed and canceled runtime remains factual wall-clock time.
03
Open the exact run behind a timing signal
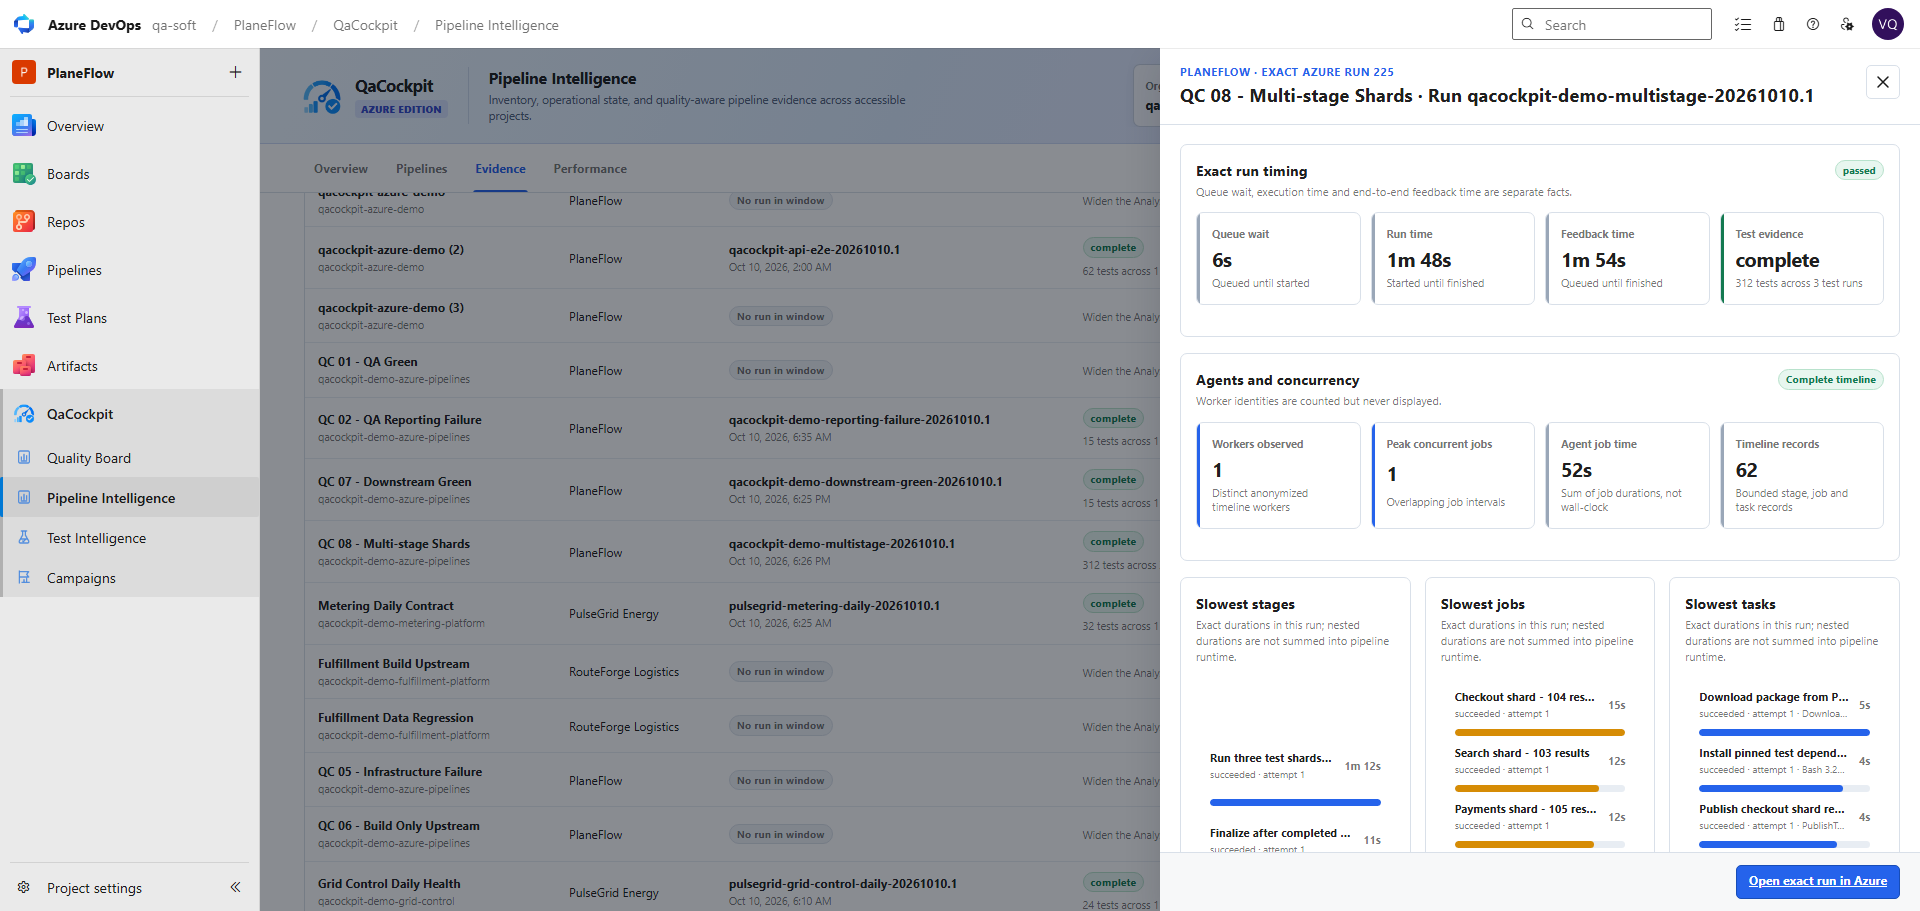
Exact-run detail shows queue wait, run time, end-to-end feedback time, test-report state, anonymized worker count, peak concurrency, agent job time, and the available stage, job, and task timeline. Rankings stay bounded to five rows while stating the complete observed total.
The Azure link opens the exact build. Test evidence identifies complete, partial, missing, and unavailable reports independently of the pipeline result.
04
Unavailable data remains explicit
Pipeline Intelligence follows both the extension scopes and the signed-in user's native Azure permissions. Inaccessible projects and pools are not disclosed. If Azure Analytics does not return agent-request observations, observed queue p95 and agent-request wait show Not available instead of zero.
vso.codereads the exact run commit to locate one unique YAML task after you open an affected run.vso.analyticsreads bounded pipeline, task, and agent-request timing facts.vso.agentpoolsreads pools, queues, agents, and recent jobs for aggregate and anonymized capacity views.
QaCockpit does not change source code, display worker identities or capabilities, or persist raw agent assignments. Existing installations require an Azure DevOps organization administrator to authorize these scopes before upgrading to 1.1.0.